
Edward B. Allen [Allen 2002, Allen et al. 2007] created a set of graph and hypergraph-based metrics to evaluate the complexity, coupling and size of programming artifacts. The approach is based on information entropy (see information theory for details). We developed Eclipse tooling to compute these metrics for various ECore metamodels and Java programs. In this post, we describe the application of this tooling to Java programs in Eclipse.
Installation
The tooling is available as source code at github, but we provide also an Eclipse update site: https://build.se.informatik.uni-kiel.de/eus/se/snapshot/
For the installation in Eclipse:
- Select the menu item Help
- Choose Install New Software
- Click the Add… button
- Add the update site URL
- Choose the Software Artifact Evaluation and all additional function you want to use. You need at least the Core Framework and Metrics and Java Project Support
- Press Next
- Press Finish
Using the Evaluation Tool
We assume you already have a Java project open in your Eclipse IDE. It makes no difference whether this is an J2EE project, Servlet project, plain Java project, Maven project etc. In this tutorial, we use the org.iobserve.analysis project.
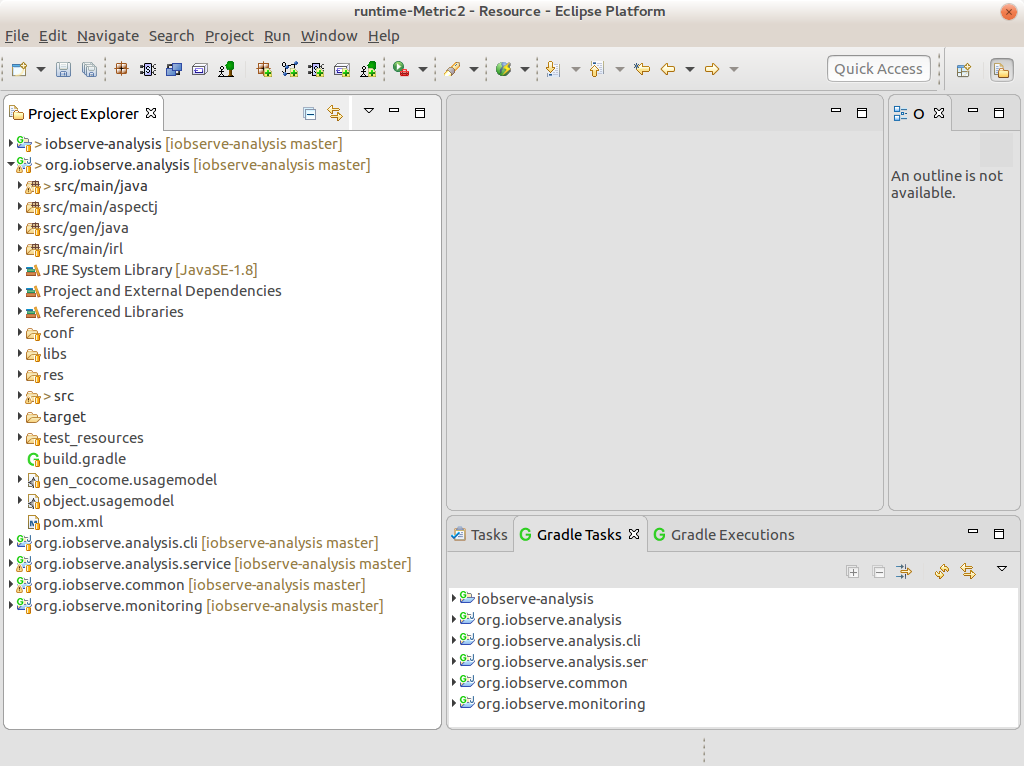
Figure 1: The iObserve analysis projects
Before we can run the analysis, we must define which part of the code should be taken into account for the analysis. In Java everything is a class (except of enumerations and primitive data types). However, Java classes can represent behavior or just data types. Also not all of the Java code might belong to the part of the software which should be analyzed. Therefore, we have to define which classes are used as data types and which represent the observed system.
The two sets of classes are configured via two configuration files. Each file contains a set of Java regular expressions which represent fully qualified class name patterns. Based on these patterns classes are categorized as observed system or data type class. Other classes which are referred to by method calls from the observed system are considered framework classes. They are included, but only with the used interface. That implies, that parts of the framework API which is not used, is not included in the complexity analysis.
Therefore, we define two files in the root directory of the project, called observed-system.cfg and data-type-pattern.cfg (see Figure 2).
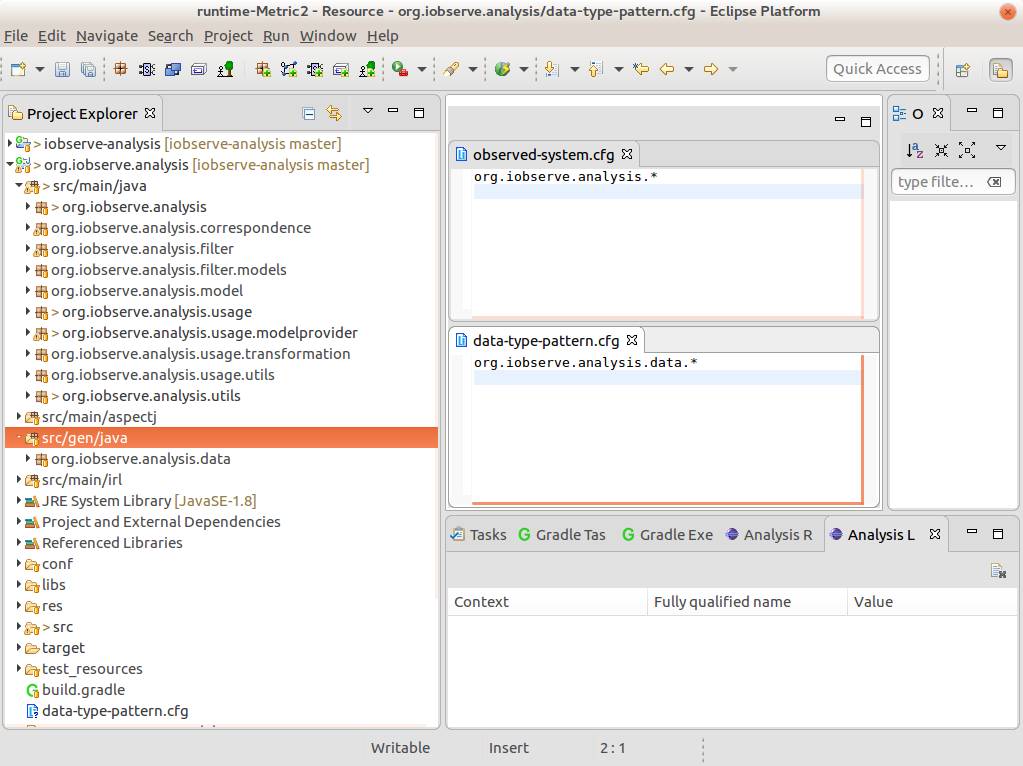
Figure 2: Two simple definitions for observed system and data type patterns.
With both files specified the analysis can be started with:
- Right click on the org.iobserve.analysis project
- Choose Java Analysis
During the analysis two views open, called Analysis Result View and Analysis Log View. The result view contains all calculated measurements of the analysis including lines of codes and complexity. In detail the result view shows (see also Figure 3):
- Size of observed system which is the number of classes belonging to the system
- Lines of code of the observed system
- N lines representing an aggregation of the cyclomatic complexity of the methods of the system. The aggregation is based on buckets. Where each bucket represents a certain cyclomatic complexity and the value indicates how many methods have this complexity.
- The number of modules are the classes, inner classes and anonymous classes which comprise the system and the used framework interfaces.
- The number of nodes are the number of methods used in these modules
- The number of edges are call or data edges between these nodes. Call edges represent method invocations while data edges refer to variable access form a method.
- The hypergraph size represents the information contained in the hypergraph
- The hypergraph complexity represents the complexity of this hypergraph
- The inter module coupling represents the complexity of the hypergraph representing only the inter module edges
- The graph cohesion describes the complexity inside the modules
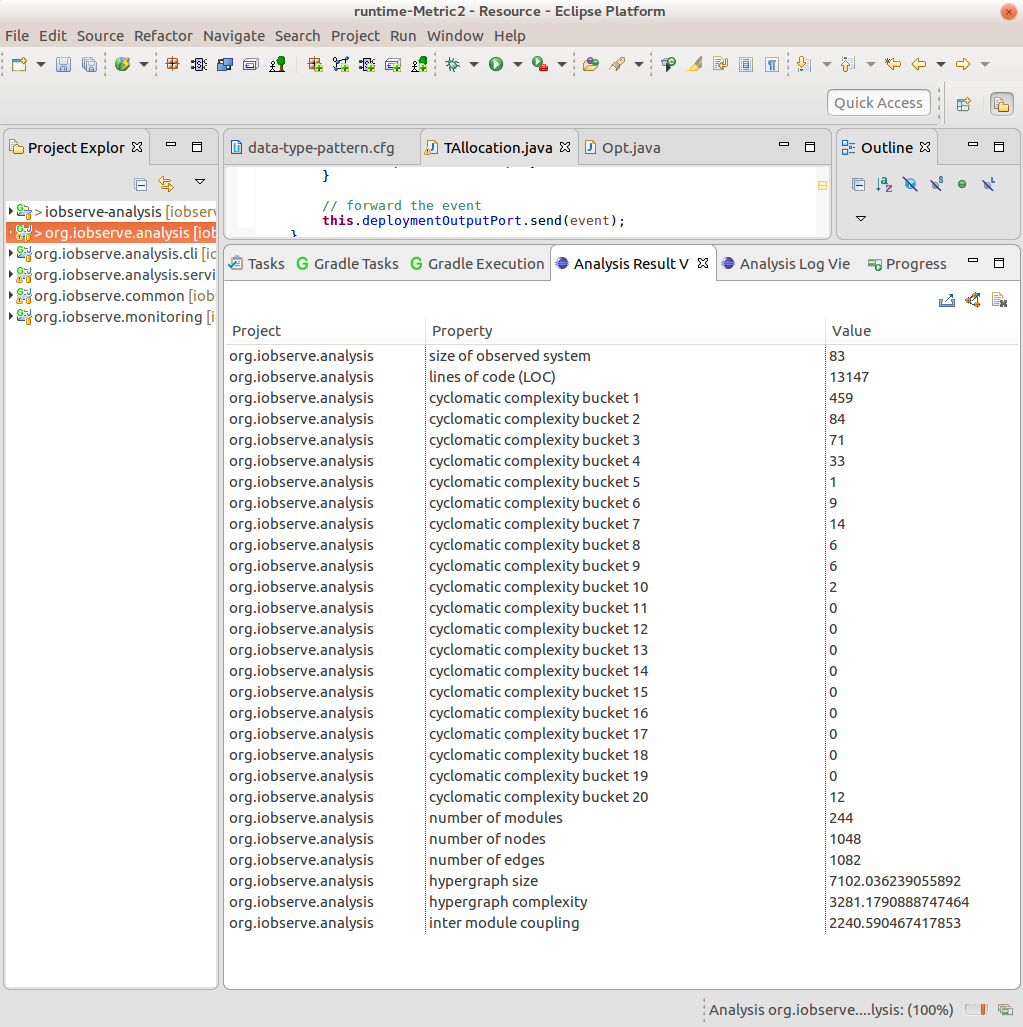
Figure 3: Analysis Result View
The result view provides three additional functions which can be activated by pressing on the little icons in the upper right of the view.
- The left button allows to export the result in a CSV file
- The center button allows to export the hypergraph
- The right button clears the result view (without warning)
The log view (see Figure 4) shows all created modules, nodes and contains warnings and errors according the construction of the Java hypergraph model. Such errors lower the overall complexity and size, as they indicate missing edges or nodes.
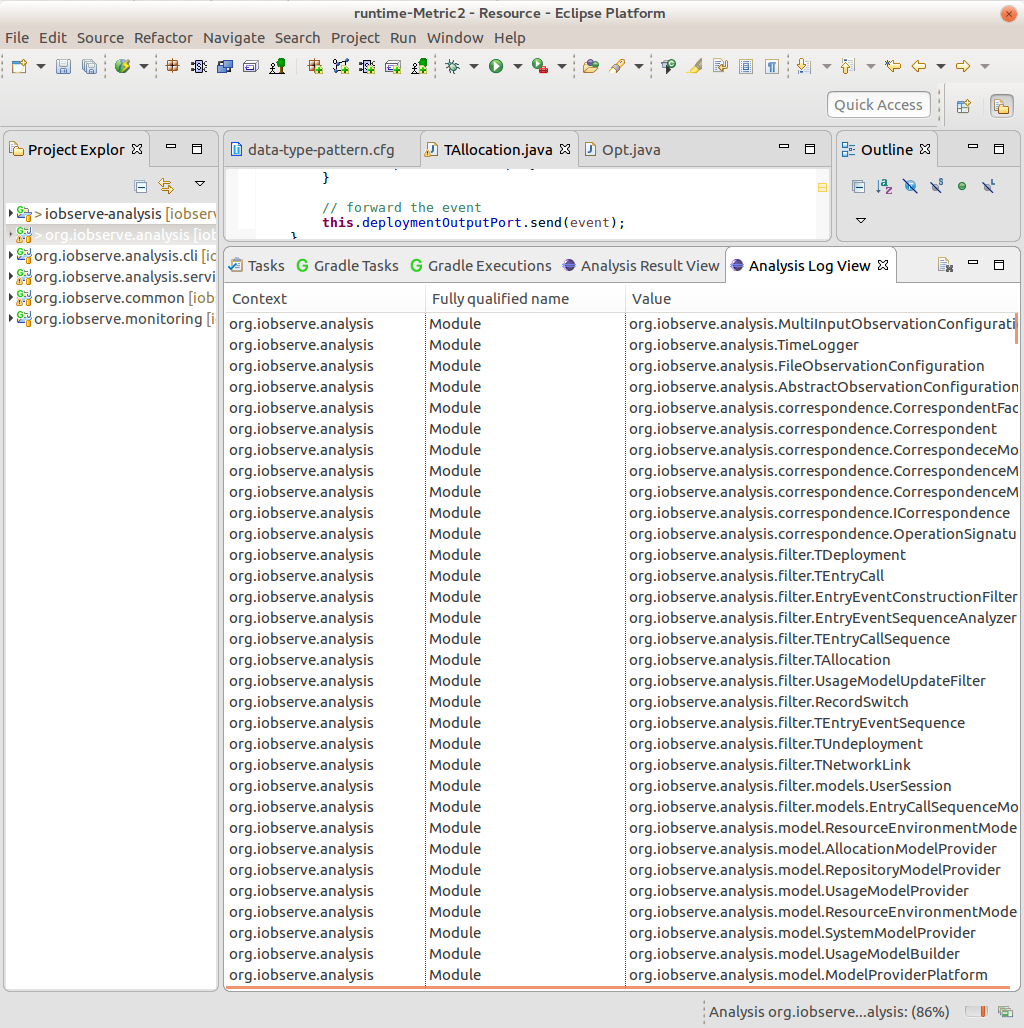
Analysis log view
Visualization of Graphs
The tool comes with tow visualizations for saved hypergraphs and modular hypergraphs. the views require Kieler and Klighd to work properly. Unfortunately, with the migration of parts of Kieler to the Eclipse project, some functionality is no longer available and activating the view requires complicated voodoo. However, in case you have a menu entry in the context menu in the project explorer labeled Modular Hypergraph Diagram, you can select a saved hypergraph file and choose this option from the menu.
Notes
When using the analysis tool, always specify the version and revision of the tool you are using. While we try to keep changes compatible with older versions. There might be additions which can result in different measurements.
Java 8 is partially supported. However, as it is relatively new, there might be constructs which are not covered by the tool and will cause an runtime error.
The analysis requires that the Java project compiles in Eclipse, as it uses the Eclipse JDT resolving mechanisms.
In Eclipse Mars, in some cases the analysis did not work properly when the library and plug-in dependencies where listed before the actual source folders.
The last measurement calculating the cohesion may require a lot of time (hours). Most annoying is a long wait time when the process bar is already at 100%. This is a known issue, but in case you want the last measurement, you have to be patient.